Flotr - Javascript Plotting Library
A developer named Bas Wenneker has released Flotr a very nice lightweight graphing package under the MIT open source license (very easy for us to use) that works on the following major browsers: Firefox 2+, Safari 3+, Opera 9+ and IE6+.
Flotr uses the Prototype Javascript framework.
Code: http://flotr.googlecode.com/svn/trunk/flotr
Try the demos on this page: http://solutoire.com/flotr/docs/
The total size of the portion of the download into your browser that implements the graphs in the examples is LESS THAN 50k!
I think this code could be a good framework to use to create a lightweight smartgraph.
I don't see any reason why we couldn't also use these graphs to support more compelling reports with interactive graphs in a browser. This graphing package could be adapted to display data from OTrunk graphs – but in a browser.
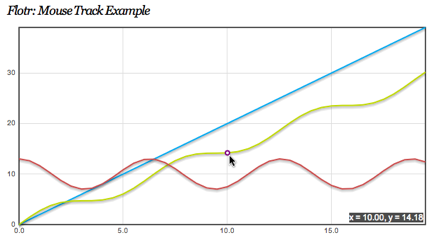
An screen shot showing displaying nearest value with mouse-tracking: